Where
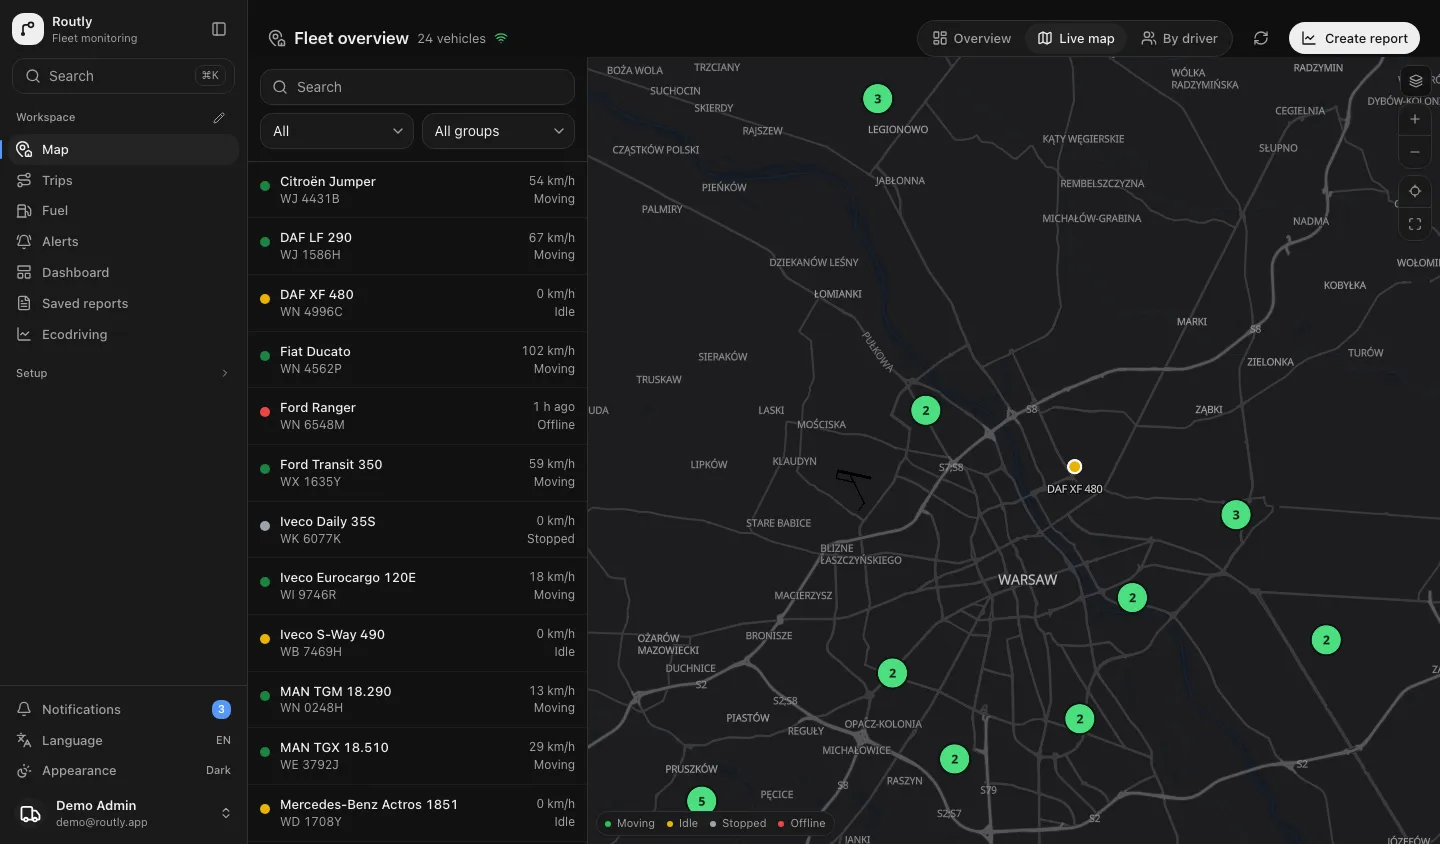
Every vehicle, one map
Positions arrive as fast as the trackers send them. A vehicle that goes quiet is marked offline instead of being left on the map where it was last seen.
Free to self-host · AGPL-3.0 · in production
Live map, trip logbook, fuel analytics and driver scoring — on your infrastructure, with every position in a Postgres you can query yourself. No per-vehicle fee: run it for your own fleet and the licence costs nothing.
The real interface with a sample fleet in it. No account, no install.
Five screens people open every day, and one thing that matters if you run more than one fleet — all of it on servers you control.
Every vehicle on one map, as often as its tracker reports. The telemetry never leaves your servers.
Trips detected automatically, with the route replayed and the distance and duration behind it.
Build the report you need, save it, schedule it. Exports as CSV, Excel or PDF.
Speeding, geofence and idling, delivered by email or to a webhook you point at your own systems.
Speed alert
Van #42 exceeds 80 km/h
Polygons or circles, as many as you like, with every entry and exit written down.
Every customer an isolated organisation, with roles and grants down to a single vehicle, and their own logo on the reports you send them.
The interface
One screen for each, below. They are captures of the demo — the same build the product ships, filled with a generated fleet so there is something to look at. Open it and you are clicking the real interface, not a picture of one.
Where
Positions arrive as fast as the trackers send them. A vehicle that goes quiet is marked offline instead of being left on the map where it was last seen.
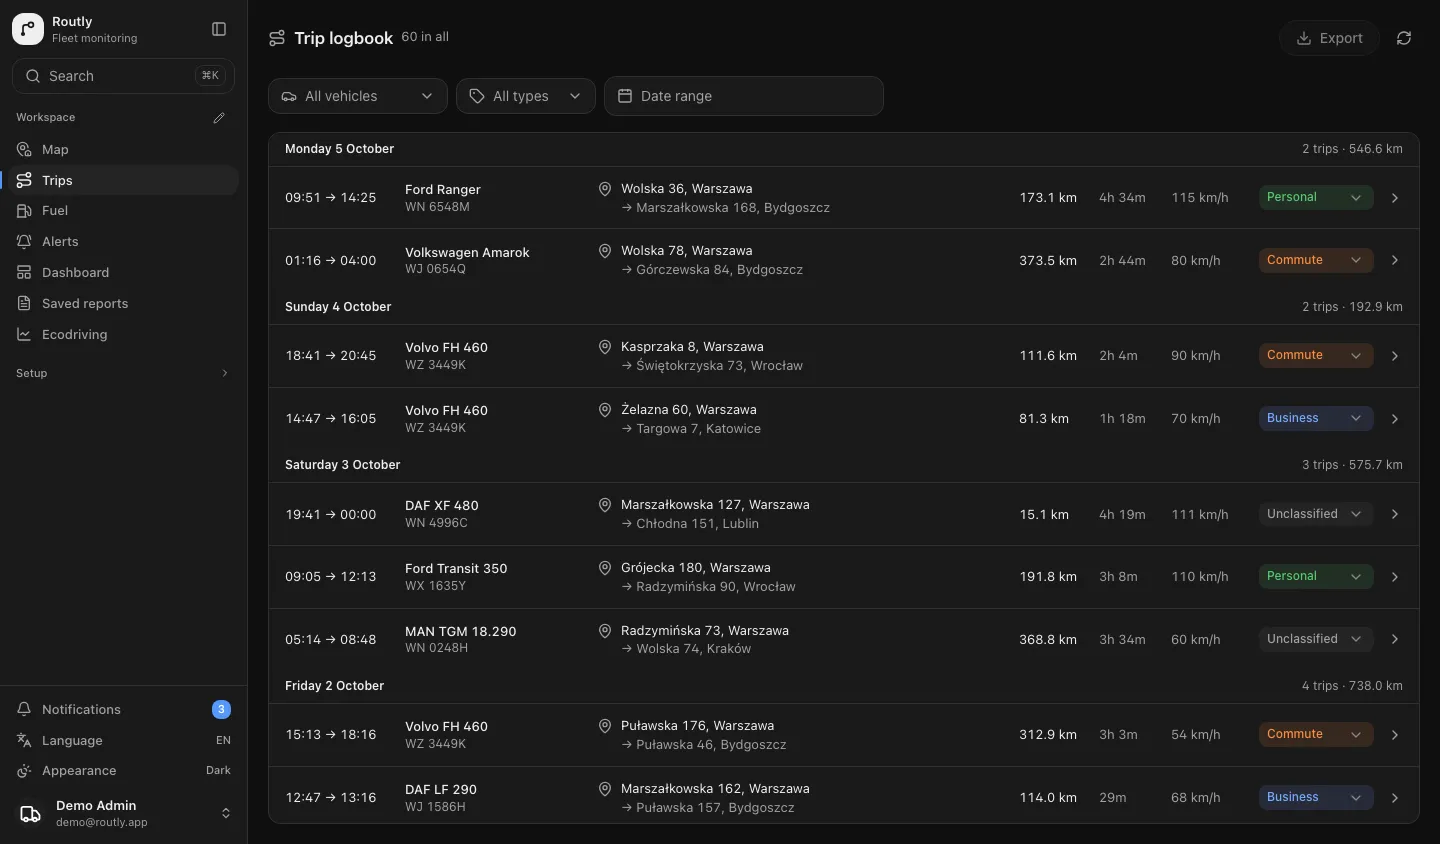
What happened
Every journey with its route, distance and duration, tagged business, personal or commute — and exported as a spreadsheet when the accountant asks.
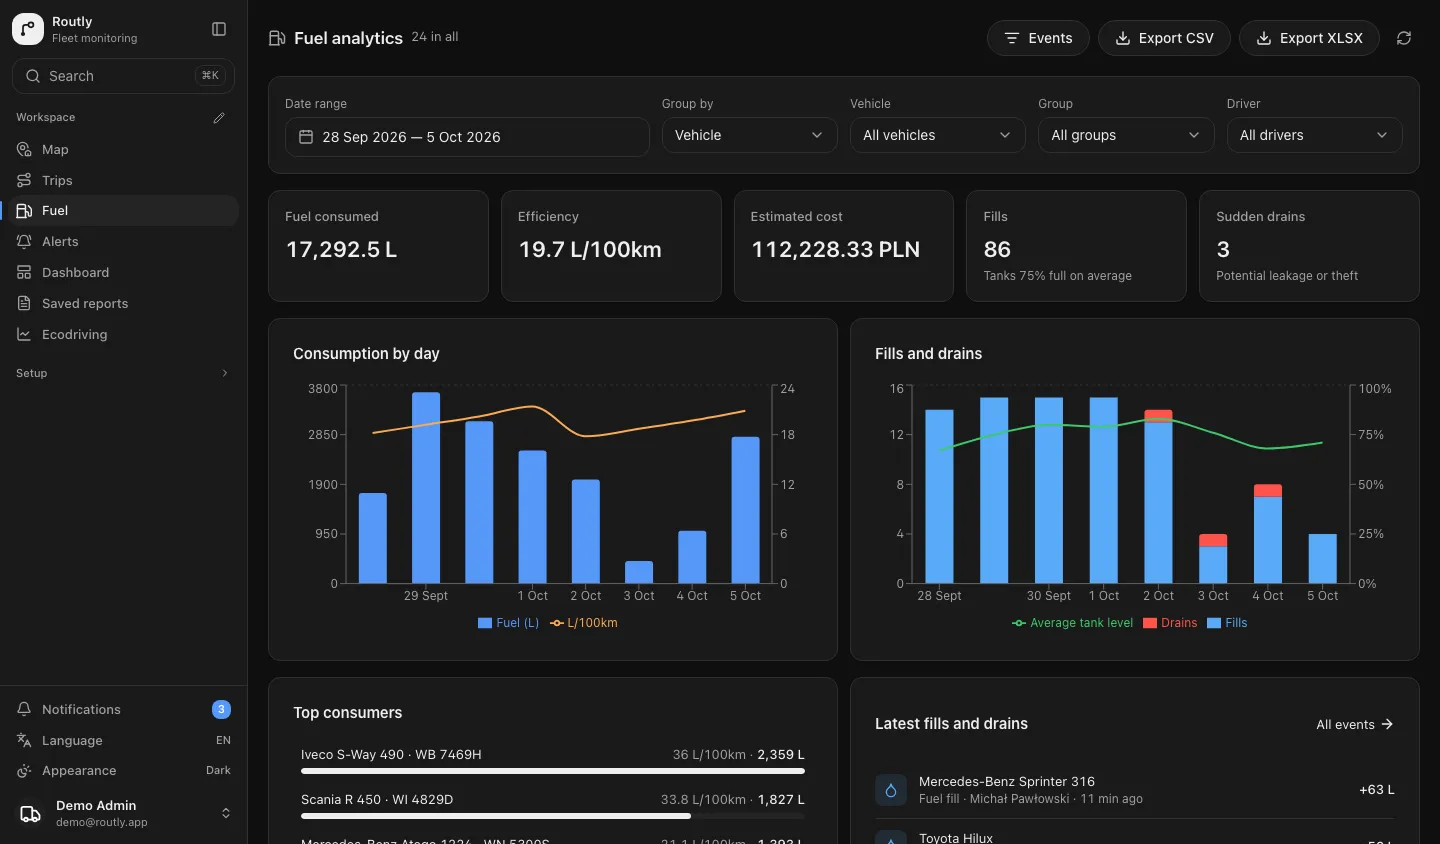
What it cost
Litres per hundred kilometres and what they cost, per vehicle — with a sudden drop flagged as a drain rather than buried in the month’s consumption.
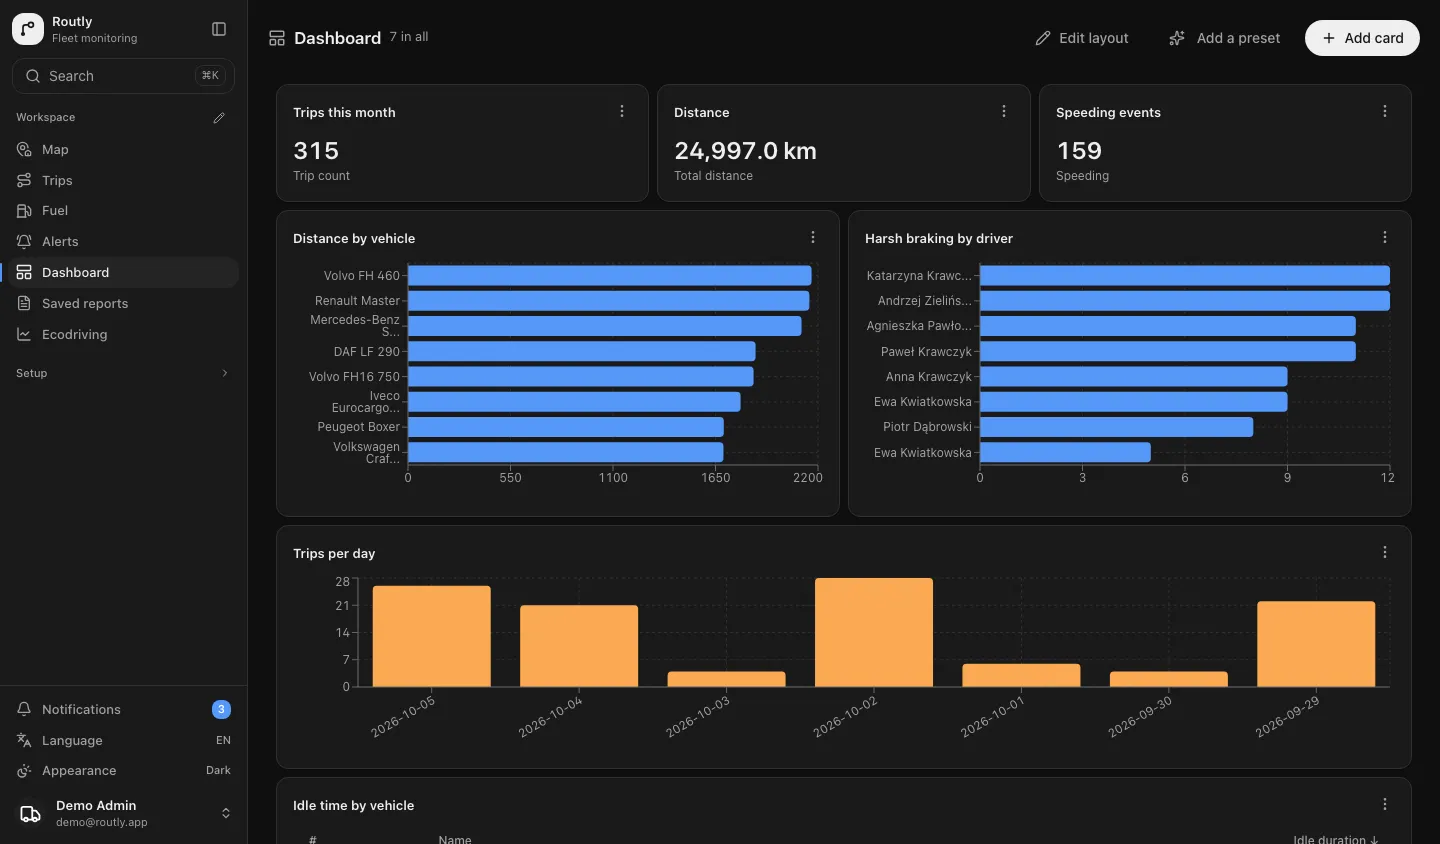
Who is driving how
Pick a metric, a grouping and a shape: distance by vehicle, harsh braking by driver, trips by day. Nobody has to ship you a new report to answer a new question.
Why people move
Price is what starts the conversation. What ends it is realising that the data, the roadmap and the terms all belong to someone else.
Cost
Per-vehicle, per-month, forever. Growing the fleet grows the invoice, and nothing you have paid so far reduces the next one.
Ownership
Years of positions and trips live in someone else's database, reachable through whatever export they choose to offer.
Control
A report you need is a feature request behind a queue you cannot see, for customers you are not.
Who moves
The three costs above land differently depending on which of you is reading. Here is the version that applies to you, and the part of Routly that answers it.
You operate the vehicles
You sell the service
Routly reads from Flespi, from Traccar, or from any gateway that can POST JSON. The trackers already in the vehicles keep reporting exactly as they do now, which is what lets both systems run side by side while you check the data.
What it costs
The same code under either licence. Which one you need is decided by what you do with it, not by how many vehicles you have.
You self-host it for your own fleet
You resell it, host it for customers, or cannot take AGPL code
Assessment, deployment on your infrastructure and running both systems side by side is work we do with you, quoted on what you already run. It is a service, not a condition — the licence gives you the source either way, and nothing stops your own team doing the deployment.
Switching
The trackers keep reporting to both systems while the data is compared, so nothing is cut over on trust. You are never without tracking, and never mid-migration without a fallback.
We go through what you run now — devices, protocols, the reports people actually open, the integrations that must keep working.
Routly goes up on your infrastructure with your branding, your users and your geofences configured.
Both systems run side by side on the same trackers while the data is checked. You switch when you are satisfied, not before.
Comparisons
Each of these says where the other product wins, because a comparison that never does is an advertisement.
Wialon Local is self-hosted too, so that is not the difference. The licence, the per-unit fee and whether you can query the database are.
Read itNot a competitor. Traccar decodes the devices and Routly reads from it — keep Traccar and put the reporting layer above it.
Read itSame licence, different question. Fleetbase is orders and dispatch; Routly is telemetry and what you sell on it. Parcels or vehicles.
Read itTwo ways to white-label. Navixy licenses you a finished product; Routly gives you the source and the running of it.
Read itGPSWOX if you want a branded platform and apps live in days with trackers pointed straight at it; Routly if you want the whole source and your own database.
Read itGpsGate decodes your devices for $3 a device a month, or on your own Windows server; Routly gives you the source and your own database.
Read itStay for driver terminals, dispatch and tachograph data; leave for self-hosted telemetry on open trackers, and budget for new hardware.
Read itFleetio runs the workshop — work orders, inspections, parts; Routly is self-hosted telemetry. Different jobs, and many fleets need both.
Read itAll the comparisons and the migration guides, including the five-way roundup of self-hosted platforms.
Nothing exotic to run: a Postgres, a ClickHouse, a Redis and one API, brought up with a single compose file.
Vehicles, trips, users
Measured on production
A single node is fine
Flespi, Traccar or webhook
No map vendor bill
One file, five services
One service
A static bundle
Keep it. Traccar decodes 200+ device protocols and Routly reads from it — the same way it reads from Flespi, or from any gateway that can POST JSON. Traccar gets the bytes off the device; Routly is the part your customer looks at: trips classified, fuel theft separated from ordinary burn, driver scores, and reports that arrive by email on a schedule. The long version.
Talk to us
Tell us what you run today and how many vehicles are on it — whether that is one fleet or thirty customers’ worth. We answer within one working day.
Or look around first — the demo needs nothing from you. Open it.